Mapping Classroom Dynamics: Social Network Analysis of Student Affiliation
From survey rosters to reciprocal edge lists: Uncovering cliques, structural brokers, and social isolates through graph theory
This project applies computational Social Network Analysis (SNA) to model adolescent peer relationships in secondary classrooms. By converting roster survey data into verified reciprocal edge lists, we uncover hidden social structures—identifying cohesive cliques, structural brokers, and vulnerable social isolates.
1. Theoretical Inspiration: From “Chains of Affection” to Sociometry
In their seminal sociometric study, “Chains of Affection: The Structure of Adolescent Romantic and Sexual Networks” (American Journal of Sociology, 2004), Peter S. Bearman, James Moody, and Katherine Stovel demonstrated that adolescent social ties rarely form random graphs or tightly isolated nuclear units. Instead, they organize into intricate, spanning topological networks governed by unspoken behavioral rules and micro-level norms.
Applying graph theory to educational settings shifts classroom management from subjective observation to empirical relational science:
\[\mathcal{G} = (V, E)\]
Where: - Vertices (\(V\)) represent students within a class cohort. - Edges (\(E\)) represent validated social bonds, collaborative partnerships, or mutual friendships.
Every educator knows that a classroom is never a uniform collective—it is a living, dynamic socio-cognitive ecosystem. Mapping this topography empowers teachers to optimize cooperative learning pods, dissolve communication barriers, and proactively support socially isolated students before academic or emotional disengagement takes hold.
2. The Data Collection Protocol & Reciprocity Pipeline
Step 1: The Closed-Roster Sociometric Survey
To eliminate recall bias, every student in the cohort is provided with an identical digital roster: > “Select the classmates with whom you regularly study, socialize, and consider close personal friends.”
This initial instrument produces a Directed Adjacency Matrix \(\mathbf{A}\), where \(A_{ij} = 1\) denotes that student \(i\) nominated student \(j\), and \(0\) otherwise.
Step 2: Edge List Generation & Unilateral Noise
A raw nomination graph contains inherent noise: - Aspirational nominations: Selecting a socially prominent student despite lack of regular interaction. - Asymmetric expectations: Student \(A\) considers Student \(B\) their primary confidant, whereas Student \(B\) views Student \(A\) as merely an acquaintance.
Step 3: The Reciprocity (Mutuality) Filter
To extract a high-confidence backbone of authentic peer affiliation, we enforce a strict Bidirectional Reciprocity Constraint:
\[e_{(u, v)} \in E_{\text{reciprocal}} \iff (u \to v) \in E_{\text{directed}} \quad \land \quad (v \to u) \in E_{\text{directed}}\]
Only when both parties mutually nominate each other is an undirected edge established in the final network.
import pandas as pd
import networkx as nx

# 1. Ingest raw survey nominations
raw_df = pd.read_csv("student_nominations.csv") # columns: ['source', 'target']

# 2. Identify mutual (reciprocated) nominations
reciprocated_pairs = set()
directed_edges = set(zip(raw_df['source'], raw_df['target']))

for (u, v) in directed_edges:
    if (v, u) in directed_edges and u < v:
        reciprocated_pairs.add((u, v))

# 3. Construct undirected mutual graph
G = nx.Graph()
G.add_edges_from(reciprocated_pairs)
3. Empirical Case Studies: Analyzing Cohort Topographies
Using force-directed layout algorithms (Fruchterman-Reingold spring embeddings), we visualized two distinct cohorts from our empirical datasets. Each reveals radically divergent socio-behavioral dynamics:
Case Study A: The Bimodal Polarized Cohort
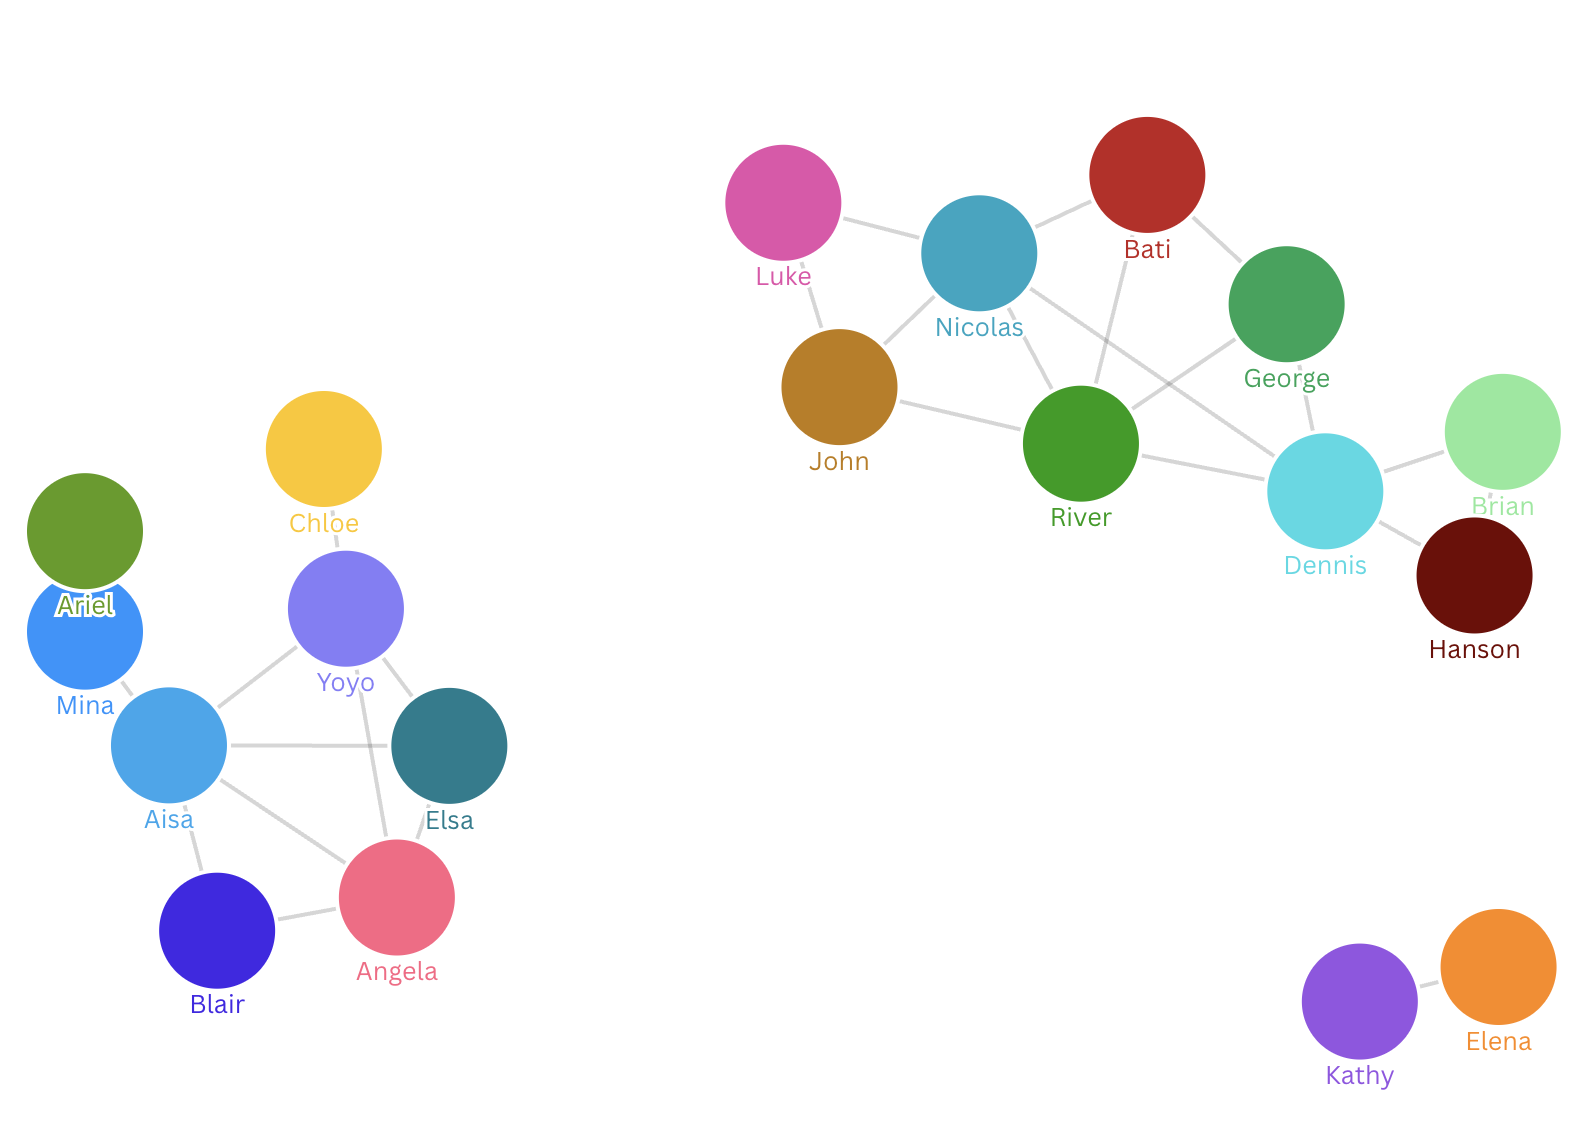
Sociometric Observations:
- Severe Structural Cleavage: The cohort bifurcates completely into two disconnected giant components with zero bridging ties between them:
- Cluster 1 (Left - 8 nodes): Formed by Ariel, Mina, Aisa, Chloe, Yoyo, Elsa, Angela, and Blair, exhibiting dense internal connectivity and high triadic closure.
- Cluster 2 (Right - 9 nodes): Formed by Luke, Nicolas, Bati, George, River, John, Dennis, Brian, and Hanson.
- Peripheral Isolation: Kathy and Elena form a disconnected dyad at the bottom right—mutually reliant upon each other, but completely detached from the rest of the cohort.
- Pedagogical Diagnostic: Whole-class discussions in this cohort risk degenerating into an “us vs. them” tribal dynamic. Without intentional cross-group collaborative scaffolding, cross-pollination of academic ideas between these groups is nonexistent.
Case Study B: The Core-Periphery Cohort with Structural Brokers & Isolates
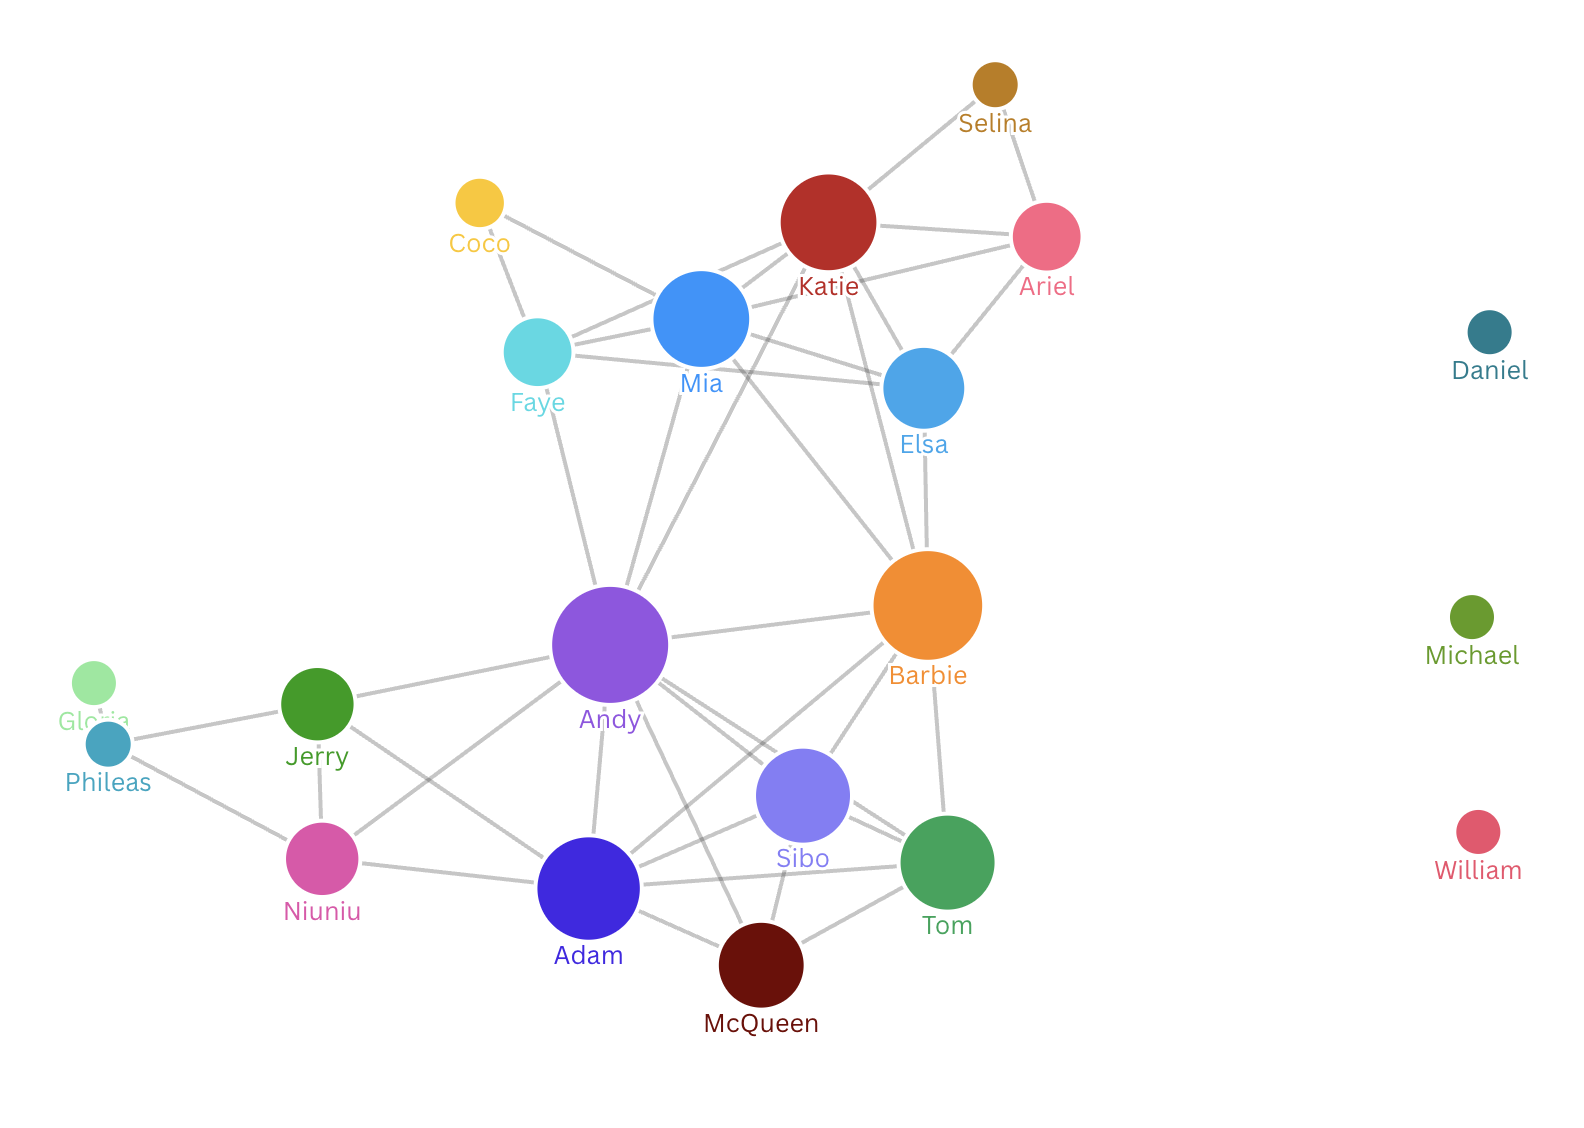
Sociometric Observations:
- The Core Component: Unlike Cohort A, Cohort B forms a single expansive giant component spanning 17 interconnected students.
- Structural Bridges & Boundary Spanners:
- Andy and Barbie occupy pivotal structural positions with exceptionally high Betweenness Centrality. They serve as the indispensable linchpins connecting the upper sub-clique (Katie, Mia, Elsa, Selina, Ariel, Coco, Faye) with the lower sub-cluster (Adam, Sibo, Tom, McQueen, Niuniu, Jerry).
- If either Andy or Barbie is absent, the informational and social cohesion between these factions drops precipitously.
- Complete Isolates (\(k_i = 0\)):
- On the far right, three students—Daniel, Michael, and William—possess an absolute degree of zero (\(k=0\)). They received no reciprocal nominations from any peers in the classroom.
- Pedagogical Diagnostic: While the connected core is vibrant, the existence of three disconnected isolates presents an urgent inclusion concern that demands sensitive, proactive intervention.
4. Advanced Sociometric Metrics Suite
To quantify these visual sociograms into actionable metrics, we compute four foundational graph properties:
\[\begin{array}{l|l|l} \hline \textbf{Metric} & \textbf{Mathematical Formulation} & \textbf{Classroom Behavioral Meaning} \\ \hline \textbf{Degree Centrality} & C_D(v) = \frac{\deg(v)}{|V| - 1} & \text{Direct social popularity and peer integration.} \\ \textbf{Betweenness Centrality} & C_B(v) = \sum_{s \neq v \neq t} \frac{\sigma_{st}(v)}{\sigma_{st}} & \text{Information brokerage; ability to bridge disjoint cliques.} \\ \textbf{Clustering Coefficient} & C_i = \frac{2 e_i}{k_i(k_i - 1)} & \text{Triadic closure ("Do my friends consider each other friends?").} \\ \textbf{Network Modularity} & Q = \frac{1}{2m} \sum_{vw} \left[ A_{vw} - \frac{k_v k_w}{2m} \right] \delta(c_v, c_w) & \text{Tendency of the cohort to fracture into sub-tribes.} \\ \hline \end{array}\]
5. Strategic Applications: Elevating Classroom Interventions
Transforming social network analysis from an academic curiosity into a high-impact pedagogical instrument yields four strategic applications:
1. Algorithmic Seating & Pod Architecture
Randomized seating charts often inadvertently cluster dominant cliques together while stranding isolates in corners. By leveraging network coordinates: - Isolate Integration: Place structural isolates (e.g., Daniel, Michael) at work tables with high-betweenness, high-empathy brokers (e.g., Andy, Barbie). Research in relational sociology indicates that students with high betweenness centrality possess the emotional intelligence and relational dexterity needed to integrate peripheral peers without awkward friction. - Bridge Construction: In polarized cohorts (such as Cohort A), intentionally compose laboratory teams by drawing one core member from Cluster 1 and one from Cluster 2, using academic tasks to cultivate new bridging ties.
2. Peer-Assisted Learning (PAL) Optimization
When designing collaborative peer tutoring: - Pairing students based purely on GPA frequently backfires if there is zero social safety. - Cross-referencing academic mastery with sociometric proximity ensures that mentors and mentees share either a direct reciprocal tie or a shared mutual connection, maximizing vulnerability and willingness to ask questions.
6. End-to-End Implementation Script
Below is the clean Python workflow using NetworkX and Matplotlib to reproduce this sociometric analysis from raw survey data:
import pandas as pd
import networkx as nx
import matplotlib.pyplot as plt

def build_classroom_network(csv_path):
    # Load raw student nominations
    df = pd.read_csv(csv_path) # expected columns: 'student', 'nomination'

    # Filter for reciprocal edges
    pairs = set(zip(df['student'], df['nomination']))
    mutual_edges = [(u, v) for (u, v) in pairs if (v, u) in pairs and u < v]

    # Initialize graph
    G = nx.Graph()
    all_students = set(df['student']).union(set(df['nomination']))
    G.add_nodes_from(all_students)
    G.add_edges_from(mutual_edges)

    # Compute centrality metrics
    degree_centrality = nx.degree_centrality(G)
    betweenness = nx.betweenness_centrality(G)

    # Identify isolates
    isolates = list(nx.isolates(G))
    print(f"Total Cohort Size: {len(G.nodes)}")
    print(f"Mutual Edges: {len(G.edges)}")
    print(f"Social Isolates Detected: {isolates}")

    return G, betweenness

# Generate Fruchterman-Reingold Visualization
def plot_sociogram(G, betweenness):
    pos = nx.spring_layout(G, k=0.45, iterations=60, seed=42)
    node_sizes = [300 + 3000 * betweenness[node] for node in G.nodes()]

    plt.figure(figsize=(12, 8), dpi=300)
    nx.draw_networkx_nodes(G, pos, node_size=node_sizes, node_color="#3b82f6", alpha=0.9)
    nx.draw_networkx_edges(G, pos, width=1.8, edge_color="#cbd5e1", alpha=0.8)
    nx.draw_networkx_labels(G, pos, font_size=9, font_family="sans-serif", font_weight="bold")

    plt.title("Classroom Mutual Affiliation Sociogram", fontsize=14, pad=20)
    plt.axis('off')
    plt.tight_layout()
    plt.show()
Conclusion
A classroom is far more than an aggregation of individual GPAs—it is an intricate social web. By deploying the mathematical rigor of graph theory and Social Network Analysis, we strip away the guesswork from classroom dynamics.
Armed with validated reciprocal networks, educators can transcend reactive discipline and practice truly relational pedagogy: actively nurturing structural bridges, dissolving bimodal factions, and ensuring that no student is left stranded on the periphery of the learning community.